
Figure 1. SFMBT2-mediated cell migration and invasion in LNCaP cells.
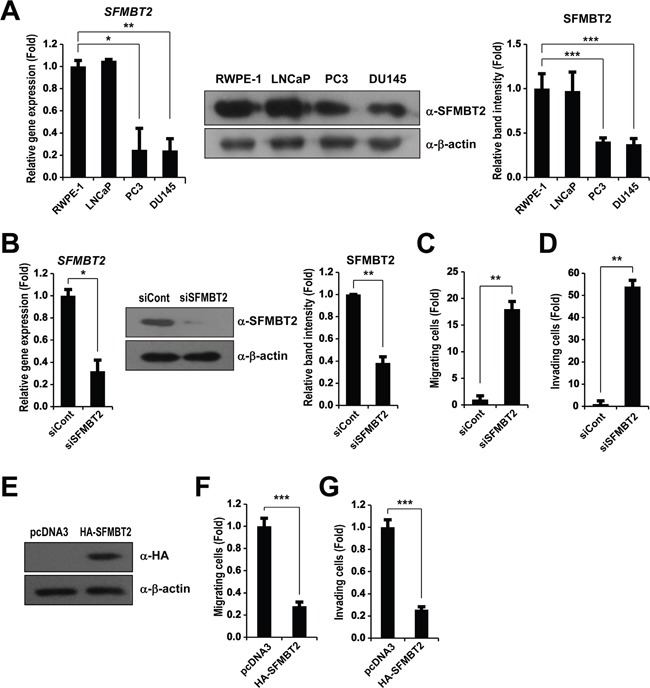
A. Differential expression level of SFMBT2 in normal prostate and prostate cancer cell lines. Transcripts of SFMBT2 and GAPDH were determined by quantitative PCR in RWPE-1, LNCaP, PC3, and DU145 cells (n=3). The cell lysates were immunoblotted with anti-SFMBT2 and anti-β-actin antibodies, respectively (n=3). Western blots were analyzed quantitatively. B. Knockdown of SFMBT2 results in increased cell migration and invasion in LNCaP cells. After control (siCont) or SFMBT2 siRNA (siSFMBT2) were transfected, LNCaP cells were subjected to RNA and protein extraction (n=3). Transcripts of SFMBT2 and GAPDH were determined by quantitative PCR. The cell lysates were immunoblotted with anti-SFMBT2 and anti-β-actin antibodies, respectively. Western blots were analyzed quantitatively. C. After control or SFMBT2 siRNA were transfected, LNCaP cells were subjected to a cell migration assay using a modified Boyden chamber containing uncoated Transwell polycarbonate membrane filters (n=3). The migrated cells stained with cresyl violet were counted. D. After control or SFMBT2 siRNA were transfected, LNCaP cells were subjected to a cell invasion assay using a Biocoat Matrigel invasion chambers (n=3). Invading cells on the membrane stained with cresyl violet were counted. E. PC3 cells were transfected with pcDNA3 or pcDNA3-SFMBT2-HA plasmid (n=3). The cell lysates were immunoblotted with anti-HA and anti-β-actin antibodies, respectively. F, G. After PC3 cells were transfected with pcDNA3 or pcDNA3-SFMBT2-HA plasmid, cell migration assay (n=3) and invasion assay (n=3) were performed. All data represent mean ± S.E.M. Significance values were * P≤0.05, ** P≤0.01 and *** P≤0.005.