


Figure 2. Effects of maraviroc on colon 26 cell tumor formation.
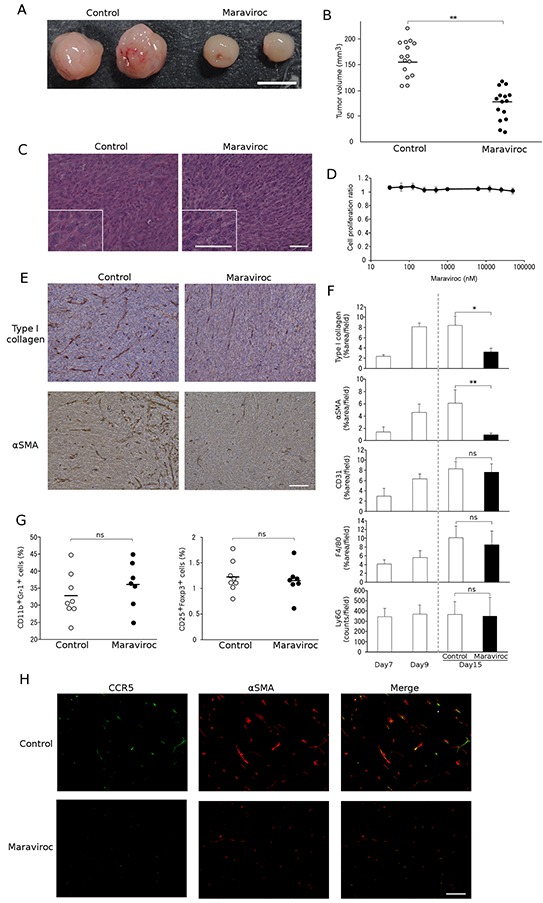
A. and B. Maraviroc was orally administered to mice that had received an injection of colon 26 cells into the cecal wall as described in Materials and Methods. Tumors were resected at day 15 after the injection. Representative macroscopic appearances of tumors are shown in A. Tumor volumes were determined and each symbol in B indicates the tumor volume of each mouse. The mean value was calculated for each group (n = 15) and is shown with a bar. p values were calculated using Mann-Whitney's U test. **p<0.01. C. Microscopic appearance of tumors. Tumors were resected at day 15 after the injection and were subjected to hematoxylin and eosin staining. Insets indicate high power magnification. Representative results from 5 individual animals are shown. The scale bar indicates 50 μm. D. Effects of maraviroc on the in vitro cell proliferation of colon 26 cells. In vitro cell proliferation was conducted in quadruplicate as described in Materials and Methods. The means and SD values were calculated and are as shown. E. and F. Tumor tissues were obtained at day 15 and subjected to immunohistochemical analysis using anti-Ly6G, anti-F4/80, anti-CD31, anti-type I collagen, or anti-α-SMA antibodies. Representative microscopic appearances of CAFs in tumor tissues are shown in E. The scale bar indicates 50 μm. Positive areas were determined as described in Materials and Methods. The means and SD values were calculated from 5 animals and are shown in F. Statistical significance was evaluated using one-way ANOVA, followed by Tukey-Kramer's posthoc test. *p<0.05; **p<0.01; ns, not significant. G. Immunosuppressive cell infiltration into inoculated tumors. Single cell suspensions were obtained from tumor tissues at 15 days after tumor inoculation and subjected to flow cytometric analysis to determine the populations of CD11b+Gr-1+ MDSCs and CD25+Foxp3+ Tregs among the CD45 cells. Each symbol indicates a separate mouse. The mean value was calculated for each group (control: n = 8, Maraviroc: n = 7) and is shown with a bar. p values were calculated using Mann-Whitney's U test. ns, not significant. H. Double-color immunofluorescence analysis of CCR5-expressing cells using anti-CCR5 and anti-α-SMA antibodies. Representative results from 5 independent experiments are shown. The scale bar indicates 50 μm.