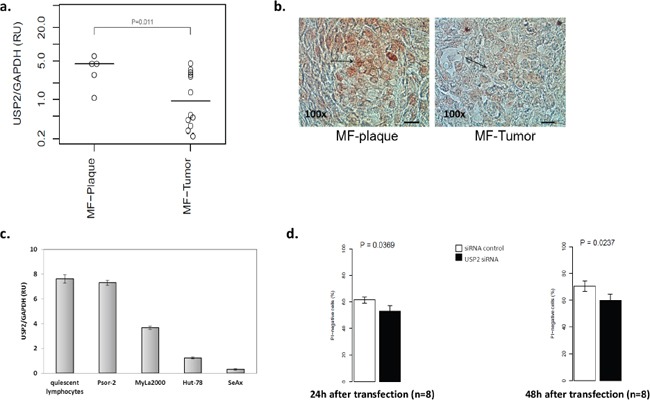
Figure 1. USP2 is expressed in CTCL with a stage-dependant manner.

Analysis of USP2 mRNA expression in paraffin-embedded biopsies from MF-plaque (n=5) and MF-tumor (n=13) a. and in quiescent lymphocytes and a panel of cell lines, Psor-2, MyLa2000, Hut-78 and SeAx c. by qPCR. Data was normalized to GAPDH and expressed as relative units (RU). Unpaired T-test was used to calculate P-value. Columns, mean (n = 3); error-bars, SD. b. USP2 protein expression in 5 MF-plaque and MF-tumor was detected by immunohistochemistry. Red color indicates USP2 expression. Bar=50μm. Arrows highlight lymphoma cells. d. Analysis of USP2 knockdown in MyLa2000 cell viability. Columns, mean (n = 8); paired T-test was used to calculate P-value, error-bars, SEM. PI-negative cells represent viable cells.
