
Figure 1. Expression of miRNA-200a and HGF in NSCLC (magnification ×200).
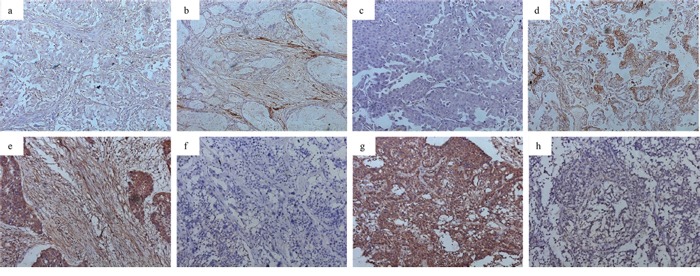
a. low miRNA-200a in stromal fibroblasts; b. high miRNA-200a in stromal fibroblasts; c. low miRNA-200a in cancer cells; d. high miRNA-200a in cancer cells; e. high HGF expression in stromal fibroblasts; f. low HGF expression in stromal fibroblasts; g. high HGF expression in cancer cells; h. low HGF expression in cancer cells.