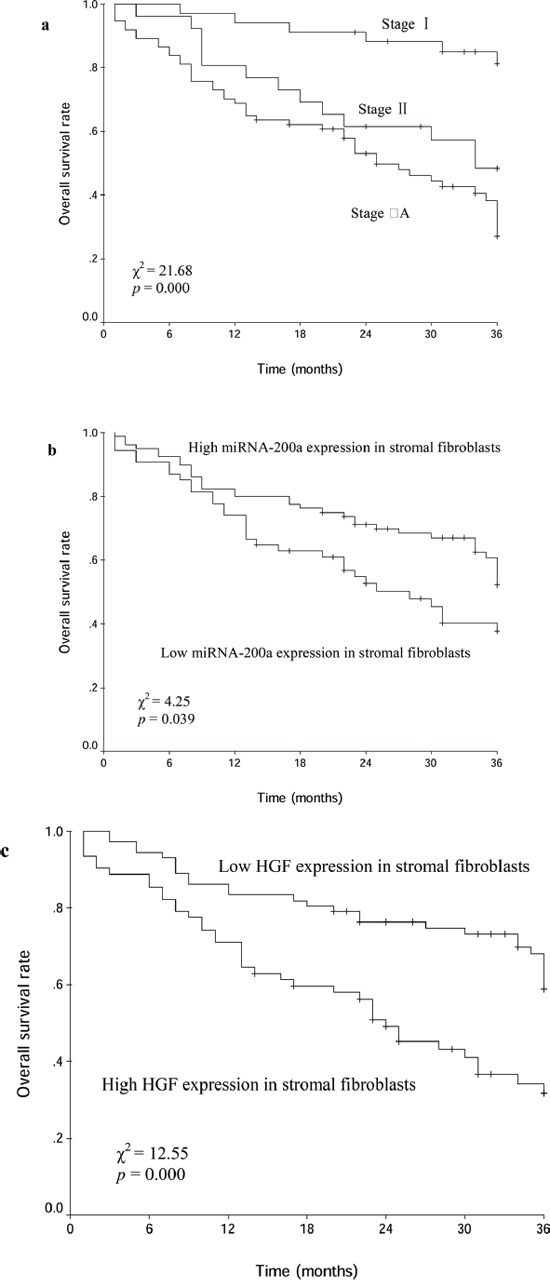
Figure 3. Kaplan-Meier curves for patients with clinical stage I- IIIA NSCLC after curative resection.

a. different clinical stage groups; b. miRNA-200a expression groups; c. HGF expression groups.

a. different clinical stage groups; b. miRNA-200a expression groups; c. HGF expression groups.