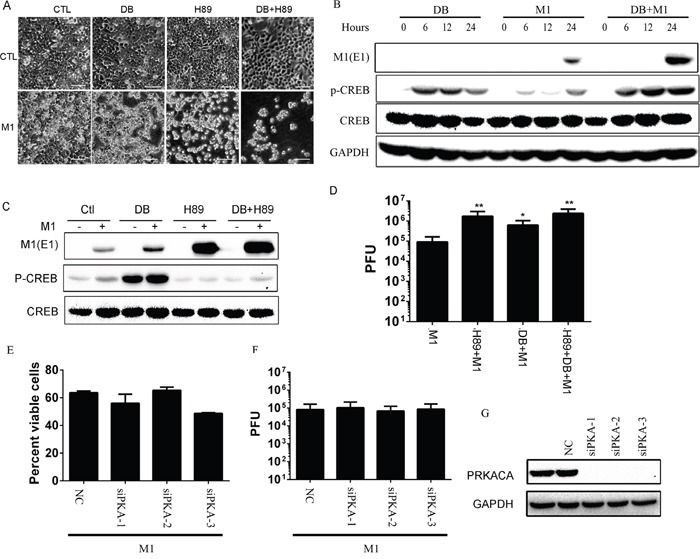
Figure 1. The oncolytic effects of M1 virus after PKA modulators treatments.

A. Morphological observation of HCT-116 after various treatments. Cells were pretreated with H89 (10μM) for 1 hour or not and then treated with db-cAMP (500μM) or M1 (1 PFU/cell). Pictures were captured with light microscope 72 hours post infection. CTL, control; DB, db-cAMP. Scale bars=50μm. B. db-cAMP treatment activates the PKA/CREB pathway. HCT-116 cancer cells were treated with db-cAMP (1 mM) or not in the presence or absence of M1 (1 PFU/cell) infection. C. H89 blocks the phosphorylated CREB and increases viral protein E1 expression. HCT-116 cancer cells were pretreated with H89 (10μM) for 1 hour or not and then treated with db-cAMP (500μM) or M1 (1 PFU/cell). Protein expressions were determined 24 hous post infection. D. H89 and db-cAMP increases the replication of M1 (mean ± SD). HCT-116 cancer cells were pretreated with H89 (10μM) for 1 hour and then treated with db-cAMP (500μM) or M1 (1 PFU/cell). Supernatant were collected 24 hous post infection and viral titers were determined. E-G. Knockdown of PKA does not increase the oncolytic effects of M1 virus. PKA catalytic subunit siRNA and scramble siRNA were transfected in HCT-116 cells and PKA expression was determined by westen blot 48 hour later (right). M1virus (1 PFU/cell) was infected after knockdown of PKA for 48 hours. Cell viabilities were determined 72 hours post infection and viral titers were determined 24 hours post infection. PRKACA, PKA catalytic subunit; *p<0.05; **p<0.01.
