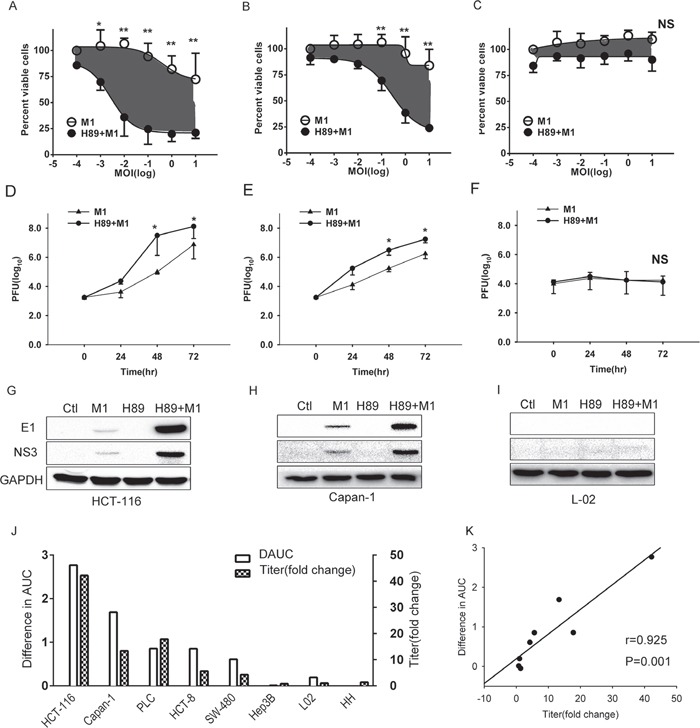
Figure 2. H89 selectively increases M1 replication and oncolysis in cancer cells.

A-C. Determination of cell viabilities with MTT assay. HCT-116, Capan-1 and L-02 cells were pretreated with H89 (10μM) for 1 hour, and then M1 virus was infected at 0, 0.001, 0.01, 0.1, 1, 10 PFU/cell. Cell viabilities were determined 72 hours postinfection with MTT assay. D-F. Viral titer determination in different cell lines. HCT-116, Capan-1 and L-02 cells were pretreated with H89 (10μM) and viral titers (supernatant) were determined at the 0, 24, 48, 72 hours postinfection (0.1PFU/cell) with TCID50. G-I. Western blots showing viral proteins E1 and NS3 expression 24 hours postinfection. Ctl, Control. J. Bar graphs depict the relative differences in AUC (area under the curve) (i.e., gray areas shown in A and B) and viral titer fold changes. H89(10μM) was treated and viral titers were determined 48 hours post infection (0.1PFU/cell). K. Correlation analysis of difference in AUC and fold change of viral titer. *p<0.05;**p<0.01; NS, not significant.
