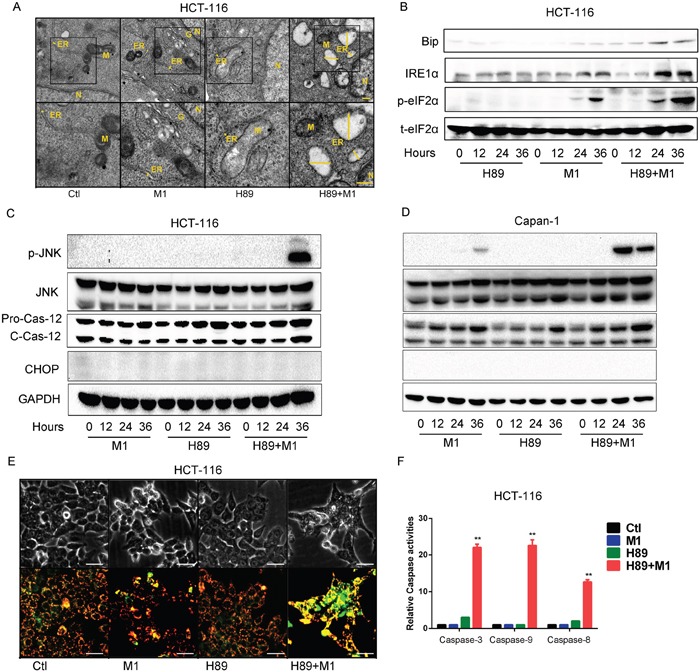
Figure 3. Enhanced oncolysis is due to irreversible ER stress.

A. Ultrastructural observation of HCT-116 cell line after H89/M1 treatment. The marker indicates the relative size of ER. Transmission electron microscopy (TEM) images (9,700, up; 13,800, down) of HCT-116 cells after 48hr of treatment with vehicle, M1 virus, H89, H89+M1; the marker indicates the relative size of the ER. N, nucleus; M, mitochondrion; G, Golgi apparatus; scale bars=250 nm. B. H89/M1 treatment induces ER stress marker expression. HCT-116 cells were pretreated with H89 (10μM) for 1 hours and subsequently infected with oncolytic virus M1 (1PFU/cell). Protein expressions were determined 0, 12, 24, 36 hours post infection. C and D. H89/M1 treatment induces phosphorylated JNK and cleaved-Caspase-12 expression. HCT-116 and Capan-1 cells were pretreated with H89 (10μM) for 1 hours and subsequently infected with oncolytic virus M1 (1PFU/cell). E. Mitochondrial potential staining with JC-1. Cells were pretreated with H89 (10μM) for 1 hour and then infected with M1 virus for 48 hours. F. Caspase-3, Caspase-9 and Caspase-8 activity assays (mean ± SD). HCT-116 cells were plated on 96-well plates and M1 virus was infected for 72 hours in the presence or absence of H89. GAPDH, glyceraldehyde-3-phosphate dehydrogenase. **P < 0.01.
