
Figure 3. EphrinA4 reverse signaling suppresses integrin mediated survival signals through inhibiting activation state.
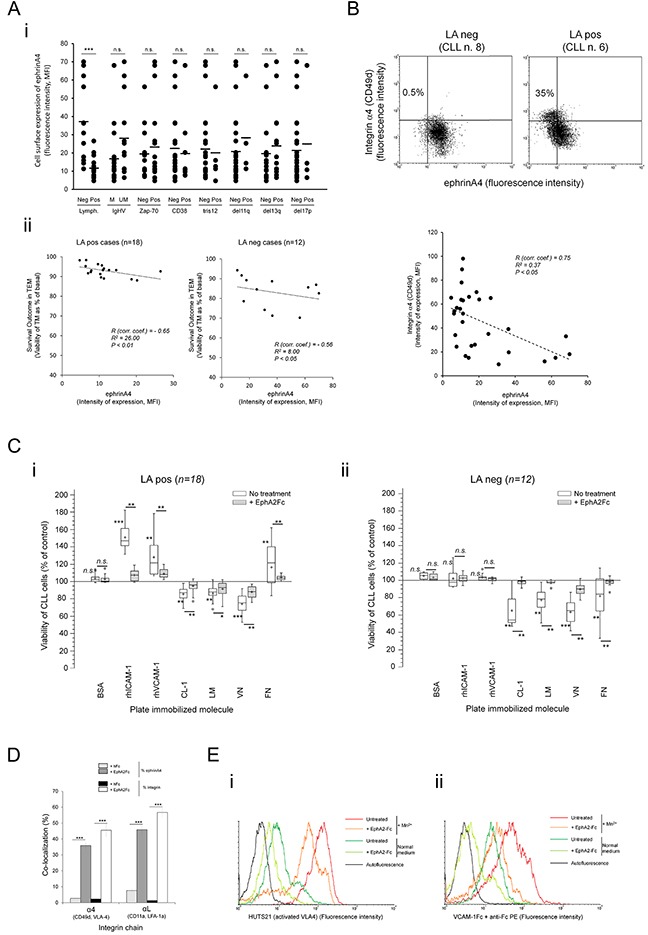
A. Expression of ephrinA4 was measured on the surface of CLL cells from 30 samples by flow cytometry analysis (MFI, mean fluorescence intensity) and (i) compared between samples according to disease parameters and cytogenetic characteristics or (ii) correlated with survival outcome of TM cells in LApos (left) and LAneg (right) cases. R: Spearman's correlation coefficient. B. Expression of ephrinA4 and CD49d (α4) on the surface of CLL cells was determined by flow cytometry (upper panels). Correlation analysis between ephrinA4 and α4 expression (mean fluorescence intensity, MFI) of samples. C. CLL cells from 30 patients (i, LApos; ii, LAneg) were preincubated (+EphA2Fc) or not (No treatment) with saturating amounts of soluble recombinant human EphA2 extracellular domains (EphA2Fc) and cultured for 12 hours in suspension in untreated plates (control) or plates containing the indicated molecules pre-immobilized to wells. BSA was used as a non-specific immobilized protein. Viability of CLL cells onto each protein is shown as percentage of basal levels in control suspension cultures without immobilized proteins. Statistical significances are shown for comparison between untreated cultures to control cultures or for EphA2Fc treatments to untreated conditions. Whisper-box plots: mean (+) and median (−) values. D. CLL cells from LApos samples (n=3) were preincubated in suspension with poly-His tagged EphA2Fc or hFc as control. Cell suspensions were then incubated with biotin anti-His followed by AlexaFluor488 streptavidin and adhered to slides for 15 min (37°C). After paraformaldehyde fixation (4% PF in PBS) slides were incubated with AlexaFluor647 conjugated monoclonal Ab for the indicated integrin chains and analyzed through confocal microscopy (Supplementary Figure S6). At least 3 fields per experiment were evaluated for colocalization analysis (Colocalization Tool, Image J). ≥ 200 cells per sample were analyzed. E. CLL cell suspensions (105 /assay) were incubated for 30 min with EphA2Fc or Fc only in RPMI/2% FCS (Normal medium) or containing 1mM MnCl2 (Mn2+). Next, CLL cells were incubated with a PE coupled HUTS21 mAb in cold PBS (i) or PE coupled anti-Fc preclustered VCAM-1-Fc in normal medium (ii) followed by flow cytometry analysis. A representative LApos CLL sample is shown (n>3 samples). Paired two-tailed Student's T test significance values: * P<0.05; ** P<0.01; *** P<0.001.