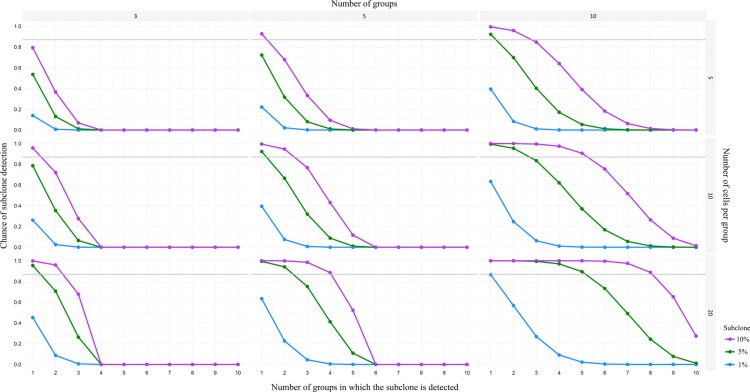
Figure 2. Power analysis for detection of minor subclones in pools of CTC.
Chances of detection of minor subclones (i.e. 1%, 5%, or 10%), calculated with a power of 0.87, for three different number of groups (i.e. 3, 5, or 10 groups) and three different number of cells per group (i.e. 5, 10, or 20 cells). As depicted in the lower right graph (10 groups of 20 cells), there is a 90% change of detecting a 1% subclone in 1 out of 10 groups, or detecting a 5% subclone in 5 out of 10 groups, or detecting a 10% subclone in 8 out of 10 groups.

