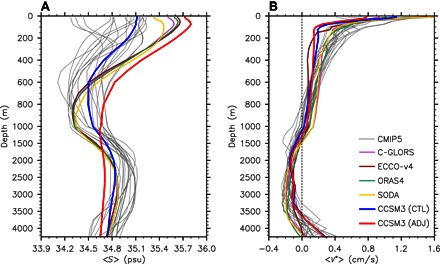
Fig. 2. Salinity and velocity profiles.

Zonal mean (A) salinity and (B) baroclinic meridional velocity at the southern boundary (~34°S) of the Atlantic as a function of depth. psu, practical salinity units. Annual mean results are calculated from reanalysis data [C-GLORS (pink), ECCO-v4 (brown), ORAS4 (green), and SODA (yellow)], the CMIP5 model simulations (gray), and the CCSM3 CTL (blue) and ADJ (red) runs.
