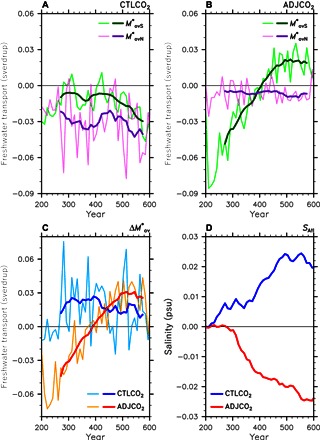
Fig. 3. Evolutions of freshwater transport and salinity.

Decadal mean anomalies in double CO2 simulations (relative to the climatology in the CTL and ADJ) for freshwater transports (light green) and (pink) in (A) the CTLCO2 and (B) ADJCO2, for (C) in the CTLCO2 (light blue) and ADJCO2 (orange), and for (D) the Atlantic basin mean salinity ΔSAtl in the CTLCO2 (blue) and ADJCO2 (red). A 90-year running mean is applied to , , and during years 251 to 600, with results shown in thick lines. Smoothed (dark green) and (purple) are shown in (A) and (B), whereas smoothed is shown in (C), in blue for the CTLCO2 and in red for the ADJCO2.
