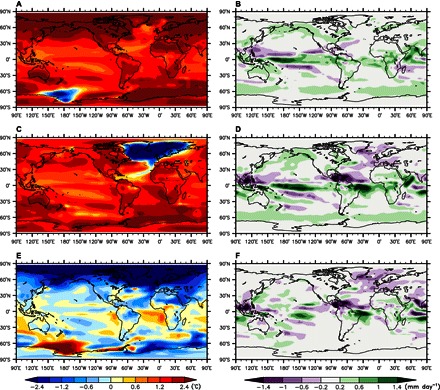
Fig. 4. Long-term (after 300 years) responses of surface temperature and precipitation to CO2 increase.

(A, C, and E ) Results of annual mean temperature (shading in °C): (A) the CTLCO2 minus the CTL (C) the ADJCO2 minus the ADJ, and (E) the difference between (C) and (A). (B, D, and F) Similar to (A), (C), and (E) but for the results of annual mean precipitation (shading in mm day−1).
