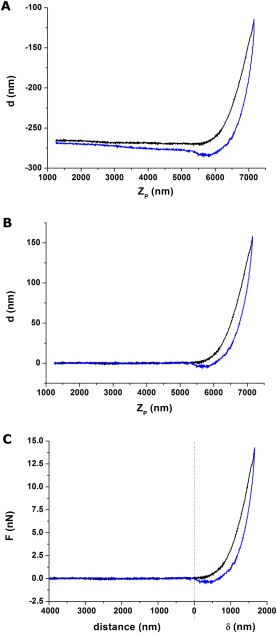
Figure 4.

a) Raw data corresponding to a ramp performed using a pyramidal tip at 1Hz. Black line corresponds to approach curve and blue line to withdraw curve. The left part of the curve corresponds to the noncontact region (impacted by a very mild tilt and also hydrodynamics‐induced splitting between the approach and withdraw curves). The right part corresponds to the contact region of the ramp. The nonlinear behavior of the curve suggests that the sample is being indented (increasing contact area between indenter and sample). The lower but positive deflection values observed for the withdraw part suggest that the sample is viscoelastic. b) The noncontact part is used to correct for tilt and hydrodynamics effects. The behavior in the right part of the curve indicating a soft, viscoelastic sample is preserved. c) Once the contact point is established, the force curve can be subdivided into two regions dominated by tip‐sample distance (left part) and sample indentation (right part). Cantilever deflection (nm) has been converted to force (nN) using the known cantilever stiffness (.09 N/m).
