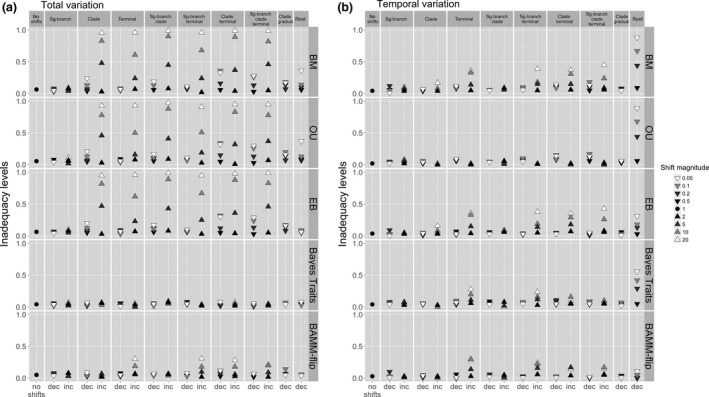
Figure 5.

Model inadequacy levels (quantified as the frequency of trees and associated trait data where the focal model was inadequate) across a simulated Brownian motion process (no shifts, i.e. shift magnitude = 1) and rate‐heterogeneity scenarios: internal branch shift; clade event; rate changes on isolated, terminal branches; rate burst followed by gradual decreases within a clade, and constant rate‐deceleration process from root to tips. Single‐process (BM, OU and EB) and variable‐rates models (BayesTraits and BAMM with time‐flip proposal) are considered. Inadequacy levels measure model ability to account for (a) total rate variation and (b) temporal variation. Inadequacy is quantified separately for rate increases (inc, up‐pointing triangles) and decreases (dec, down‐pointing triangles), and the exact magnitude of each shift is highlighted by the white–black colour scheme. For scenarios involving gradual rate changes, the natural logarithm of the shift magnitude represents the constant rate‐change parameter.
