
Figure 6.
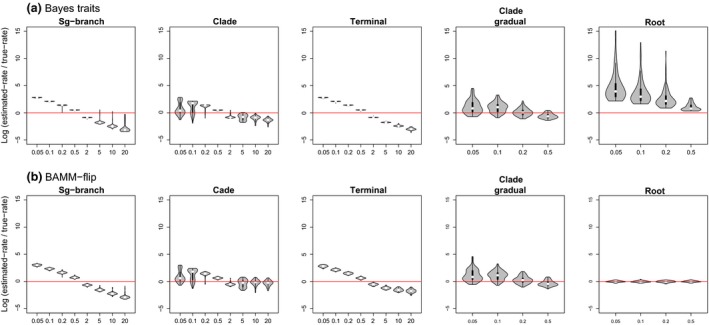
Distributions of log‐proportions between rates estimated by variable‐rates models and the true (simulated) rate changes on the identical branches. Distributions are shown for various shift magnitudes (x‐axis) and heterogeneity scenarios: internal branch shift; clade event; rate changes on isolated, terminal branches; rate burst followed by gradual decreases within a clade, and constant rate‐deceleration process from root to tips. Results for BayesTraits (a) and BAMM‐flip (b).