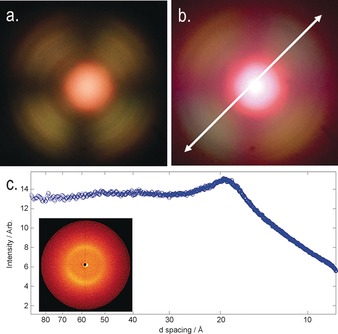
Figure 4.

a) Conoscopic figure in the NTB phase of 7 confined in a 5±0.1 μm cell with antiparallel buffed polyimide alignment layers (planar anchoring) at approximately 80 °C without a waveplate; b) the same image as in (a) but with a λ‐plate inserted into the optical path, the white arrow denoting the slow axis of the λ‐plate; c) plot of scattered X‐ray intensity as a function of d‐spacing (in the range of 8–95 Å, utilised with a sample‐to‐detector distance of 300 mm) for a partially aligned sample of compound 10 in the NTB phase at 71 °C, with an inset showing the observed 2D‐scattering pattern.
