
Figure 3.
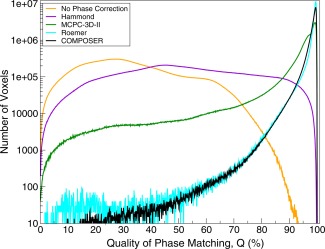
Quantitative comparison of the quality of phase matching, assessed using the quality metric Q, defined in Eq. (7). Plots are mean values over the brains of six subjects, except the Roemer method, which is for one subject. The ordinate has been scaled logarithmically to allow comparison of the relative number of voxels with poor matching.