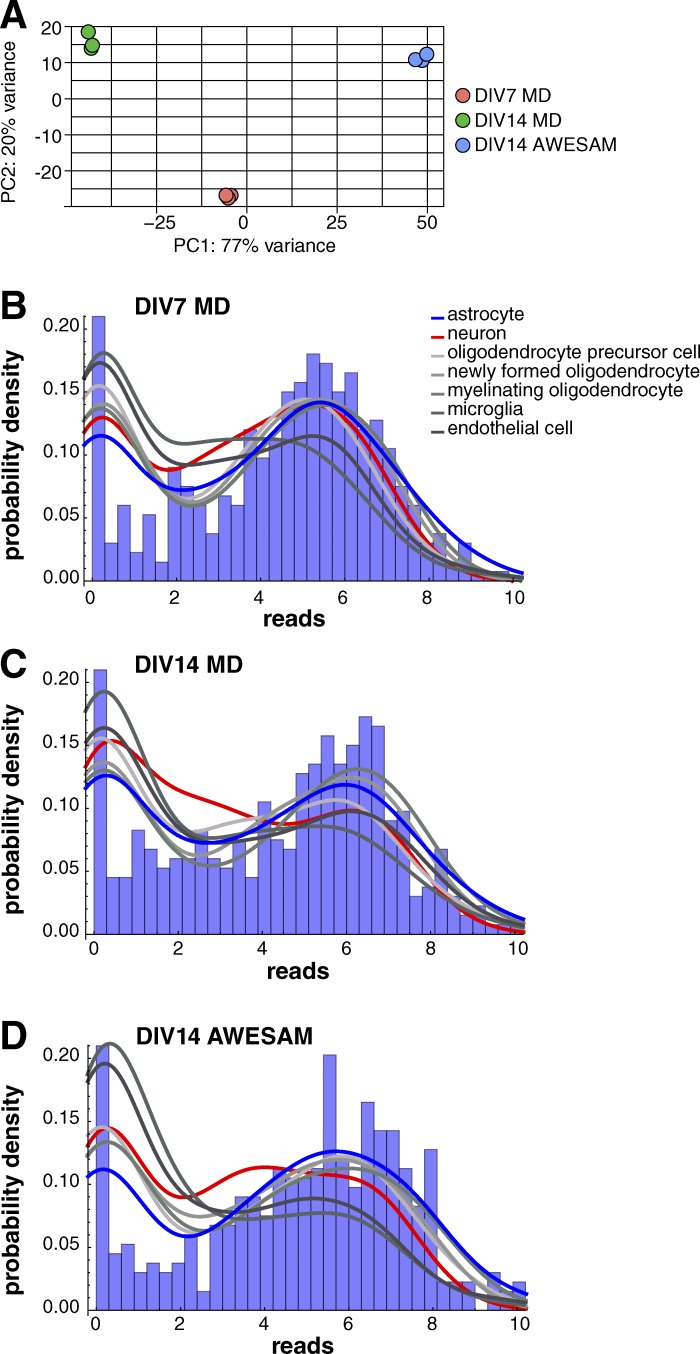
Figure 2.
AWESAM astrocytes show astrocyte-specific gene expression. (A) Cultured cell replicates show distinct clustering. The first two principal components (PC) for the regularized log transformation of the original counts for all DIV7 MD (red), DIV14 MD (green), and DIV14 AWESAM (blue) culture triplicates allow clear segmentation of conditions. (B–D) Gene expression values of 300 astrocyte (blue), neuron (red), oligodendrocyte, microglia, and endothelial (shades of gray) cell type–specific genes for each cell type (i.e., 2,100 genes total) plotted as probability density for DIV7 MD (B), DIV14 MD (C), and DIV14 AWESAM (D) cells, with the corresponding astrocyte-specific gene expression histogram underneath. AWESAM astrocytes show increased astrocyte-specific gene expression (and less nonastrocyte-specific gene expression) compared with DIV7 and DIV14 MD astrocytes.

