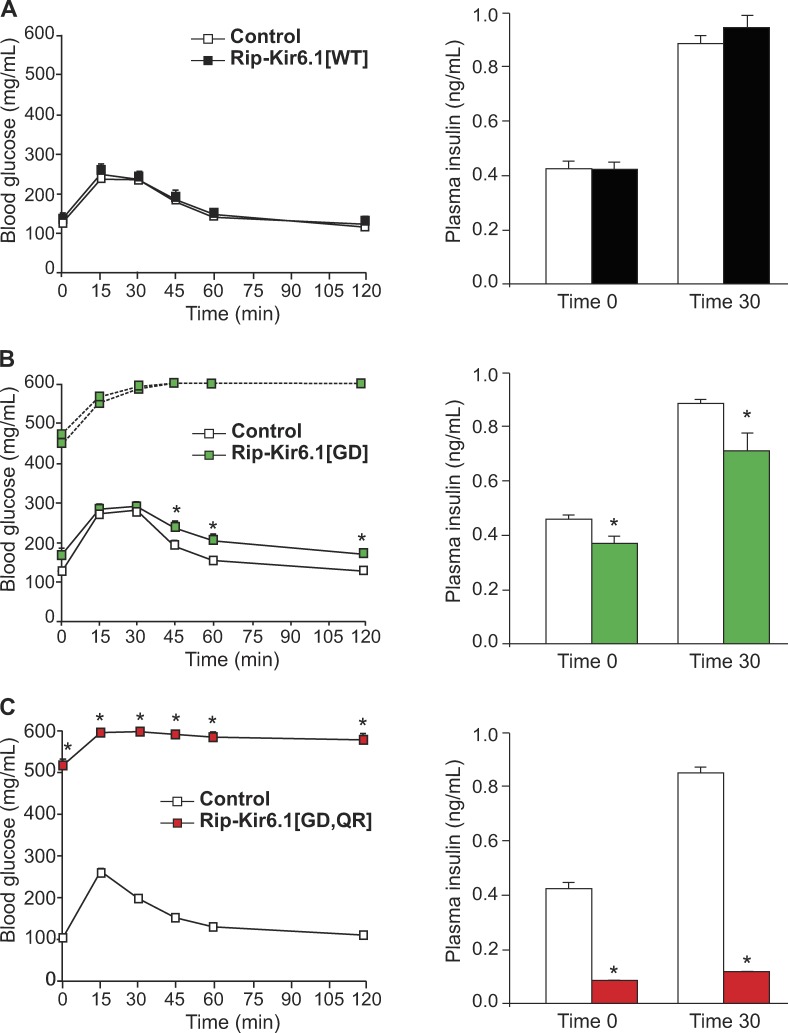
Figure 3.
Glucose tolerance in Kir6.1 transgenic mice. (A–C) GTT on 12-h fasted (left) and plasma insulin (right) in Rip-Kir6.1[WT] (A, black), Rip-Kir6.1[GD] (B, green), and Rip-Kir6.1[GD,QR] (C, red) and control littermates at 7 wk of age. Blood glucose concentration versus time after injection of 1.5 g/kg glucose. Plasma insulin was determined in fasted mice (time 0) and 30 min after glucose challenge during GTT. Data represent mean ± SEM, n = 8–10 animals in each group. For Rip-Kir6.1[GD], 2 of 10 animals, with fasting blood glucose >300 mg/dl, are shown individually (dashed line), and the remaining 8 of 10 animals, with fasting blood glucose <200 mg/dl, are shown as mean data (solid line). Significant differences (*, P < 0.05) between transgenic and control littermate mice are indicated (t test).

