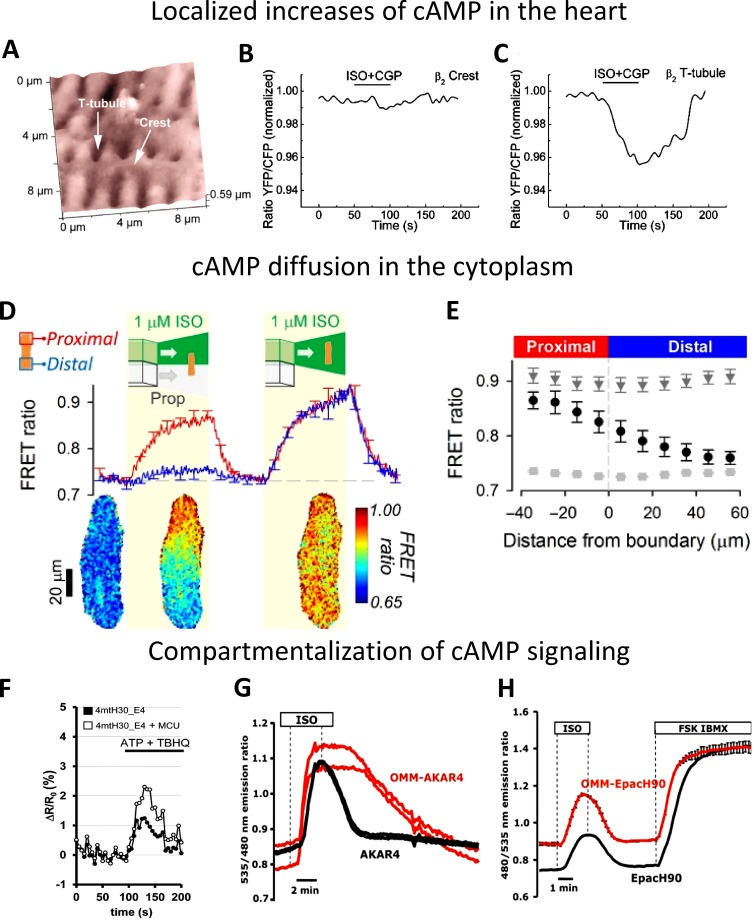
Figure 10.
cAMP signaling. (A–C) Localized increases of cAMP. (A) Scanning ion conductance microscopy image and corresponding cAMP level obtained in cardiomyocytes expressing Epac1-cAMP sensor upon local β2-adrenergic receptors (β2AR) stimulation in the cell crest (B) and in the T-tubule (C). Cells were stimulated with a β2AR agonist (ISO and CGP) in the presence of a β1AR antagonist, showing β2-cAMP signals only in T-tubules, whereas no cAMP signal was detected in cell crest (from Nikolaev et al. [2010] with permission from The American Association for the Advancement of Science). (D and E) cAMP diffusion is low in the cytoplasm of adult rat ventricular myocytes. GEI for cAMP EpacSH187 (from Klarenbeek et al. [2015] with permission from PLOS) was expressed in myocytes stimulated with β-adrenoceptor agonist and antagonist to investigate cAMP diffusion. (D) Time course of FRET ratio in proximal and distal ROIs (top) and pseudocolor representative image (bottom); (E) longitudinal profile of FRET ratio, relative to boundary position, measured under resting conditions (light gray squares), during the last 10 s of β-agonist and β-antagonist additions (black circles) to one end of the cell, and during the last 10 s of uniform exposure to β-agonist (dark gray triangles). The experiment shows the low cAMP diffusion in the cytoplasm of adult ventricular myocyte (from Richards et al. [2016] with permission from Oxford University Press). (F–H) Kinetics of cAMP levels and cAMP-dependent phosphorylation in the cytosol and on the OMM. (F) cAMP and mitochondria. Representative kinetics of intramitochondrial cAMP levels (expressed as ΔR/R0 changes) in control cells or in cells overexpressing MCU (mitochondrial Ca2+ uniporter). Where indicated, the cells were stimulated with an IP3-generating agonist (ATP) and a SERCA pump inhibitor (tert-Butylhydroquinone [TBHQ]) to induce a massive Ca2+ accumulation within the mitochondrial matrix. The data demonstrate that the amplitude of the cAMP increase in the mitochondria depends on the amplitude of the Ca2+ increase within the matrix (from Di Benedetto et al. [2013] with permission from Elsevier). (G) Kinetics of cAMP-dependent phosphorylation of the sensor AKAR4 localized in the cytosol or on the OMM; (H) kinetics of the cAMP increase with sensors localized in the cytosol or on the OMM. The data demonstrate that the kinetics of the sensor phosphorylation is very different in the cytosol and OMM (G), whereas the amplitude and kinetics of cAMP levels in the two compartments are very similar (H; from Lefkimmiatis et al. [2013] with permission from The Rockefeller University Press).

