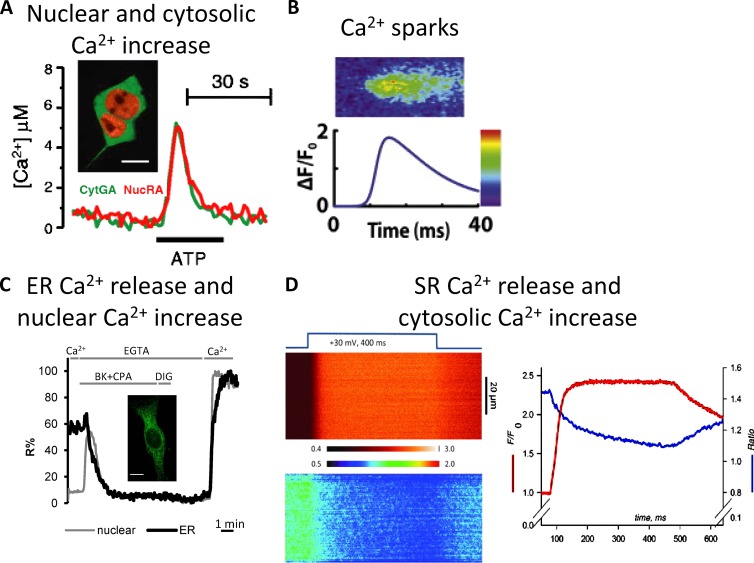
Figure 5.
Ca2+ dynamics in different cellular compartments. (A) Cytosolic and nuclear Ca2+ dynamics evaluated using cytosolic green aequorin (CytGA) and nuclear red aequorin (NucRA). (A, inset) CytGA and NucRA localization in HEK293T cells. Bar, 10 µm. (A) Representative kinetics of [Ca2+]C and [Ca2+]N (from Manjarrés et al. [2008] with permission from Springer). (B) Microscopic SR calcium release, the so-called Ca2+ sparks, evaluated using Fluo-3 (from Cannell and Kong [2012] with permission from Elsevier). (C) Measurements of nuclear and ER Ca2+dynamics using the D3 and D4 Cameleons variants, respectively. (inset) D4ER fluorescence (green). Bar, 10 µm. Representative kinetics of nuclear (gray) and ER (black) fluorescent signals in a single BHK cell coexpressing H2B-D3cpv and D4ER and stimulated with bradykinin (BK) and the SERCA inhibitor, cyclopiazonic acid (CPA), in a Ca2+-free medium (from Greotti et al. [2016] with permission from MDPI AG). (D) SR Ca2+ release and cytosolic Ca2+ increase in flexor digitorum brevis (FDB) monitored using the FRET-based D4cpv-Casq1 SR sensor and the cytosolic dye X-rhod-1. FDB was voltage-clamped and subjected to depolarization as indicated. (left, top) Normalized line scan of fluorescence of X-rhod-1 (cytosolic signal). (bottom) FRET ratio (R(x,t)) of D4cpv-Casq1 (SR signal). (right) Plot of the line averages (from Manno et al. [2013b] with permission from The Physiological Society).

