Figure 8.
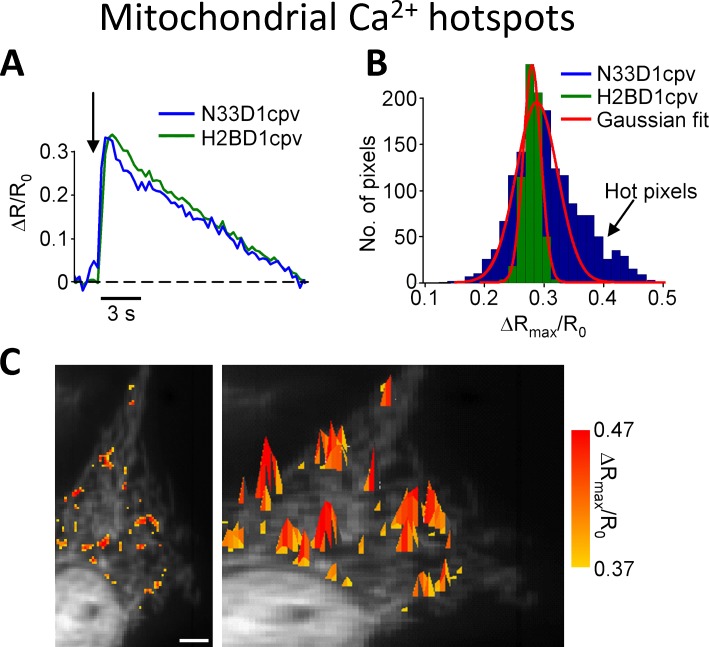
Mitochondrial [Ca2+] hotspots. Pixel by pixel correlation showing the presence of Ca2+ microdomains on mitochondrial outer membrane (OMM) upon stimulation. HeLa cells cotransfected with nuclear (H2BD1cpv)- and OMM (N33D1cpv)-targeted Cameleons were treated with 100 µM histamine where indicated by the arrow in A. (A) The average [Ca2+] rises, expressed as ΔR/R0, of nucleus (green trace) and OMM (blue trace) are very similar. (B) The number and intensity of single pixels, expressed as ΔRmax/ΔR0 of single pixels, of the nucleus (green) or OMM (blue) reached during the first 4 s after histamine stimulation were plotted. The Gaussian fit of the nuclear (green) and OMM (red) pixel distribution highlights the right tail caused by hot-spot formation on OMM upon cellular stimulation. (C) Yellow to red color representation of ΔRmax/R0 spatial distribution of pixels in 2D (left) and 3D (right), superimposed to YFP fluorescence image. Only pixels that during the 4 s after the histamine challenge have a ΔRmax/R0 exceeding by 125% the ΔR/R0 of the whole compartment were color coded. Bar, 5 µm (from Giacomello et al. [2010] with permission from Elsevier).

