
Figure 5.
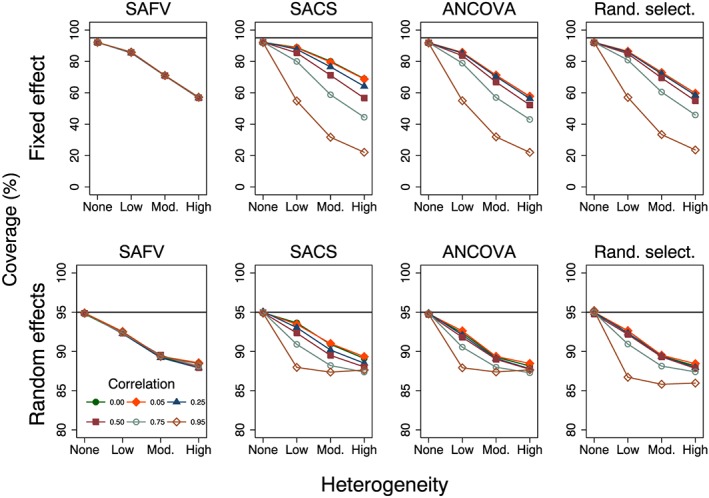
Plots of per cent coverage of 95% confidence intervals versus heterogeneity for the fixed and random effects meta‐analytical estimators calculated from four combinations of analytical methods (all SAFV, all SACS, all ANCOVA and Rand. select.). Plots represent simulation scenarios with θ = 0 and . The horizontal line represents the nominal 95% coverage level. Vertical scales differ for the fixed effect (top row) and random effects (bottom row) plots. SAFV, simple analysis of final values; ANCOVA, analysis of covariance; SACS, simple analysis of change scores; Rand. select., random selection