
Figure 7.
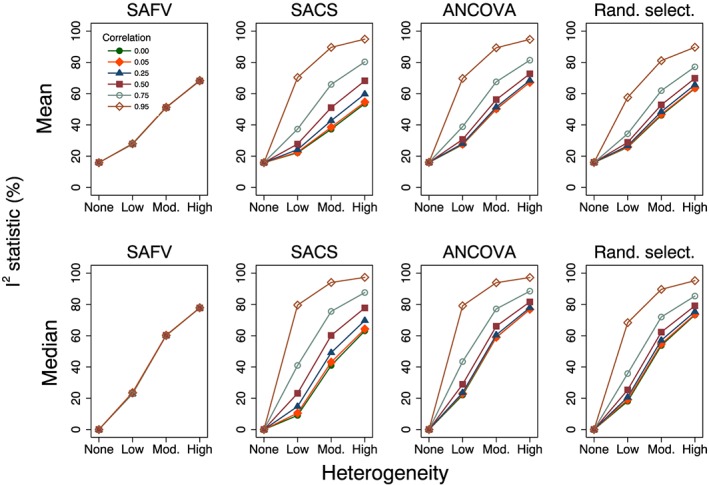
Plots of mean and median estimates of the I 2 statistic (%) versus heterogeneity. Plots represent simulation scenarios with θ = 0 and . SAFV, simple analysis of final values; ANCOVA, analysis of covariance; SACS, simple analysis of change scores; Rand. select., random selection