
Figure 8.
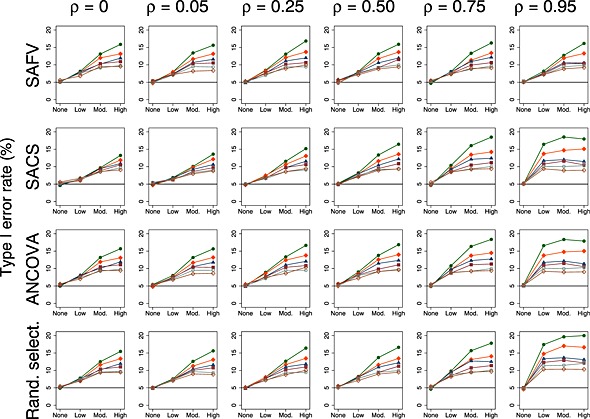
Plots of type I error rate (%) versus heterogeneity for the random effects meta‐analytical method. All plots represent simulation scenarios with θ = 0 and . Separate plots depict each combination of analytical method (all SAFV, all SACS, all ANCOVA and Rand. select.), correlation and the number of trials per meta‐analysis. The number of trials per meta‐analysis is depicted by the following colours and symbols: 3 trials = solid green circle; 4 trials = solid orange diamond; 5 trials = solid navy triangle; 6 trials = solid maroon square; 7 trials = hollow teal circle; and 8 trials = hollow sienna diamond. The horizontal line represents the nominal 5% type I error rate. SAFV, simple analysis of final values; ANCOVA, analysis of covariance; SACS, simple analysis of change scores; Rand. select., random selection