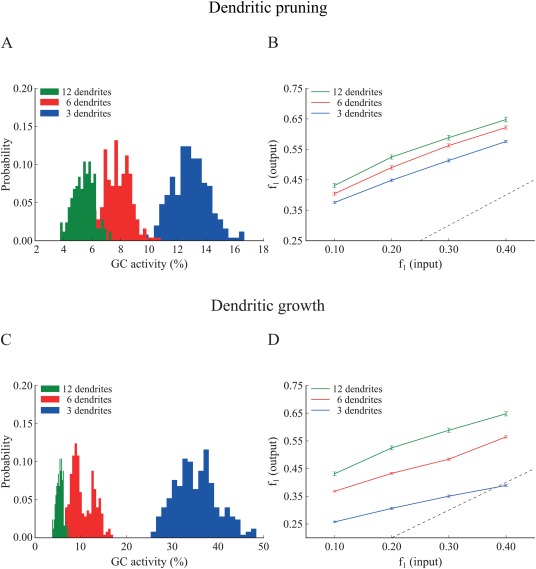
Figure 6.

Effect of GC dendritic pruning (top panel) and growth (bottom panel) on pattern separation when the input resistance ( ) is the same across models. To match , the leak conductance ( ) was increased by a factor of 1.695 and 1.230, in the 3‐ and 6‐dendrite models, respectively. A. Corresponding probability density functions of GC activity for the three GC models in response to a single input pattern at 40 Hz. GC activity distributions become more similar but remain inversely analogous to the number of dendrites: as the number of dendrites increase, the GC population becomes sparser. The respective mean firing rates of GCs are shown in Table 6. B. Input/output population distances ( ), for the 3‐dendrite (blue), 6‐dendrite (red), and 12‐dendrite (green) GC models in response to the presentation of two overlapping input patterns at 40 Hz as depicted in Figure 1B. The dashed line denotes the limit above which the model performs pattern separation. Performance improves with the number of dendrites. C. The same as in A. for the growth experiment. While distributions move closer to one another, the inverse relationship between dendritic number and mean sparsity is preserved. D. Same as in B. for the growth experiment. Pattern separation efficiency still correlates with the number of dendrites. Supporting Information Figure S5 depicts the corresponding pattern separation efficiency based on ‘rate distance’. [Color figure can be viewed at wileyonlinelibrary.com]
