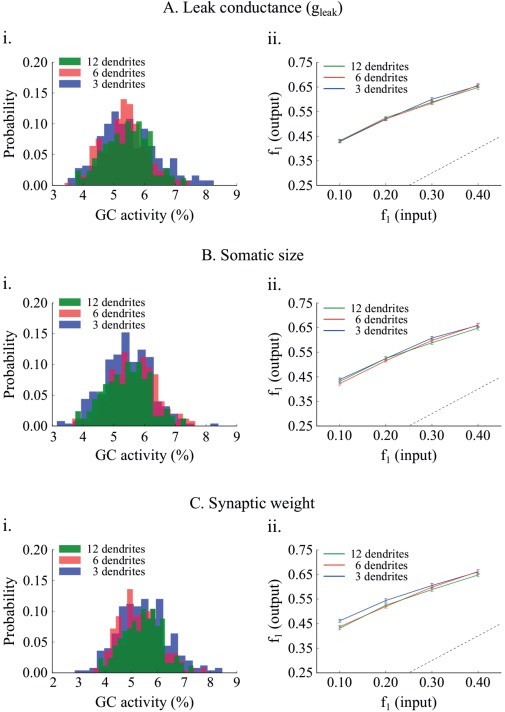
Figure 8.

Effect of matching sparsity on pattern separation efficiency. A. The “leak” conductance, , of the 6‐ and 3‐dendrite GC models increases by a factor of 1.58 and 2.48, respectively. A. i Resulting GC activity distributions are not statistically different. A. ii Networks with corrected GC models have identical performance. Differences in pattern separation using the population metric are not statistically significant. B. GC activity distributions are matched by increasing the soma diameter and length of the 6‐ and 3‐dendrite GC models by 1.48 and 1.87, respectively. B. ii The network with corrected 3‐dendrite GC models has a slightly smaller pattern separation efficiency compared to the other two probably because its activity distribution is wider. Generally the three models have very similar pattern separation performance. C. GC activity distributions are matched by decreasing the EC⃯GC synaptic weight from 1.00, to 0.75 and 0.56 in the 6‐, and 3‐ dendrite models, respectively. Pattern separation efficiency is statistically the same across all corrected GC models. [Color figure can be viewed at wileyonlinelibrary.com]
