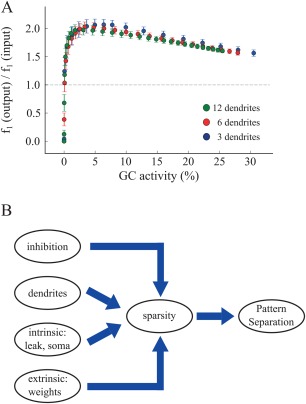
Figure 9.

A. The ratio of to for all three models as function of GC activity. Each dot represents an average of 20 trials for a specific synaptic weight value. We used values in the range of 0.0 to 25.0. For any given sparsity level, pattern separation efficiency is identical across all corrected GC models. B. Schematic representation of our proposed working hypothesis based on model predictions: sparsity is the key determinant of pattern separation. Sparsity is in turn controlled by a number of mechanisms, including inhibition, the presence of dendrites as well as various intrinsic and extrinsic mechanisms. [Color figure can be viewed at wileyonlinelibrary.com]
