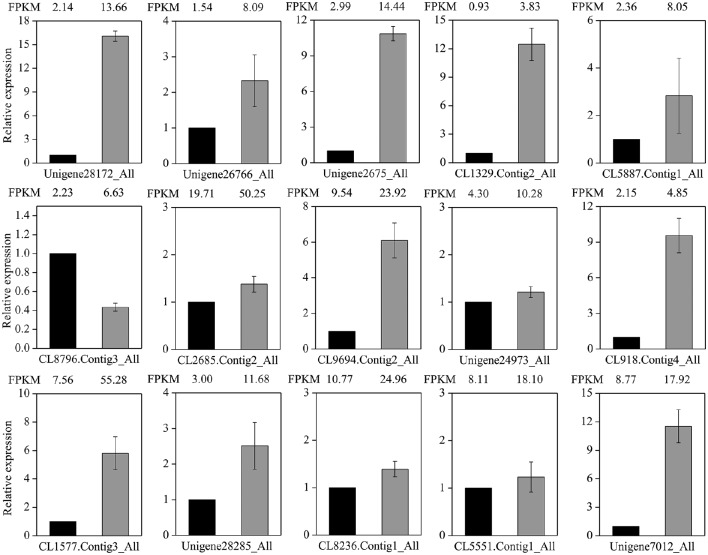
Figure 9.
Validation and comparative relative expression of 15 selected unigenes between the control and MeJA libraries in L. aurea. Differential expression between control (black column) and MeJA-treated sample (gray column) was compared. The normalized expression level (FPKM) of RNA-Seq is indicated on the x-axis. The relative expression levels were determined by quantitative real-time PCR using Cyclophilin 1 as an internal reference; each PCR was repeated three times and the error bars represent standard deviation (SD).

