Figure 2.
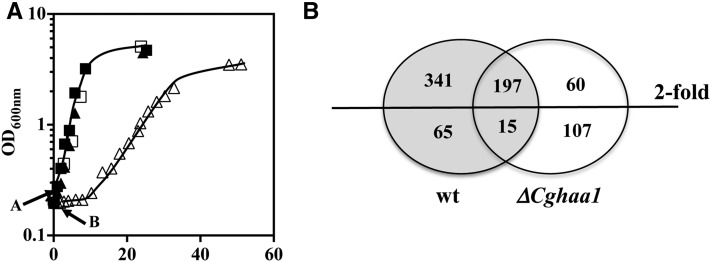
(A) Growth curves of C. glabrata KUE100 (squares) and of the deletion mutant ΔCghaa1 (triangles) in MM (pH 4.0) (closed symbols) or in this same medium supplemented with 30 mM acetic acid (pH 4) (open symbols). The arrow indicates the time of cultivation at which cell samples were harvested for the transcriptomic analysis. Growth of the cultures was followed by accompanying the increase in culture OD600 nm and in the concentration of viable cells, assessed as the number of colony-forming units per milliliter of cell culture (CFU/ml). The growth curves shown are representative of at least three independent growth curves that gave rise to the same growth pattern. (B) Venn diagram summarizing the number of genes up- or downregulated (above twofold) in response to acetic acid in cells of the parental strain C. glabrata KUE100 and/or in the mutant ΔCghaa1. wt, wild-type.

