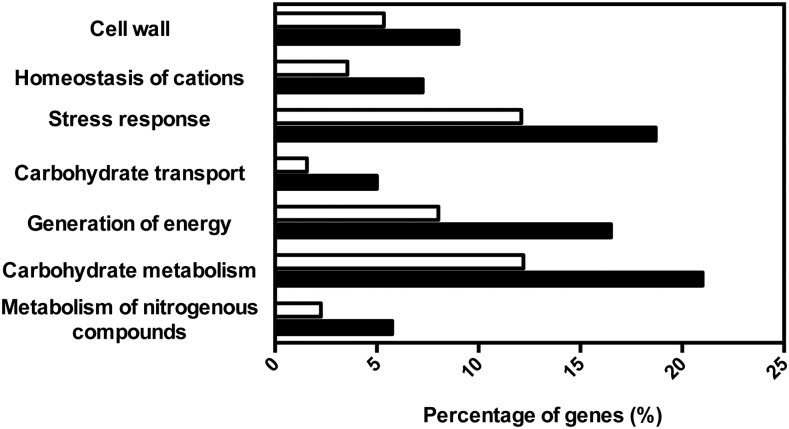
Figure 3.
Functional clustering of CgHaa1-activated genes in response to acetic acid stress. The genes found to be upregulated in response to acetic acid stress in a CgHaa1-dependent manner were clustered according to their biological function, using the MIPS Functional Catalogue database (black bars), and the enriched functional classes (p < 0.001) were selected. The percentages shown correspond to the ratio of the number of genes included in each functional class and the total number of CgHaa1-regulated genes. The white bars represent the percentage of genes clustered in each functional class using as an input dataset the entire ORFeome of C. glabrata CBS138.

