Figure 2.
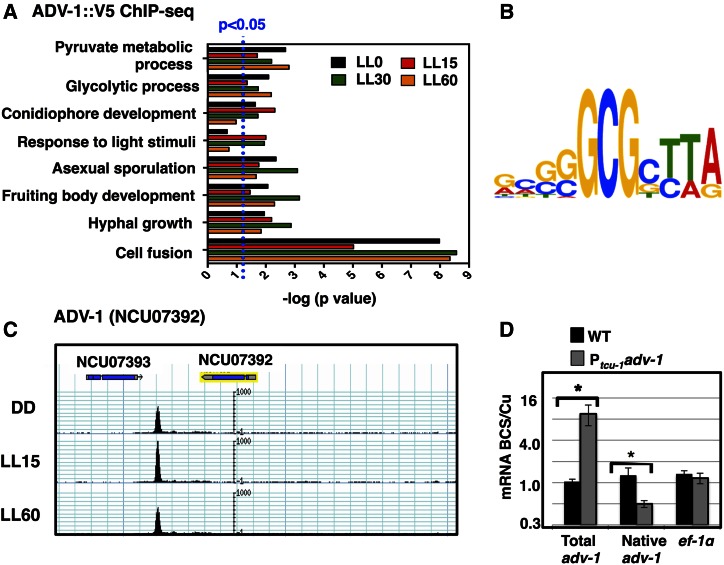
ADV-1 direct targets are enriched for genes involved in light responses, development, and metabolism, and ADV-1 potentially negatively regulates its own expression. (A) GO analysis of predicted ADV-1 direct target genes identified by ChIP-seq from cultures grown in the dark (LL0) and in LL for 15, 30, and 60 min. The GO terms (y-axis) for significantly enriched categories are shown (P ≤ 0.05; indicated by the dotted blue line) at one or more time points (x-axis). For visualization, the P values are plotted as the −log. (B) Analyses of ADV-1 binding sites in the 30 most significant peaks identified by ChIP-seq revealed an ADV-1 consensus-binding site. The relative height of each nucleotide (shown in the 5′ to 3′ direction) reflects the degree of sequence conservation in the ADV-1 consensus-binding site. (C) ChIP-seq track showing ADV-1::V5 binding downstream of the adv-1 coding region from cultures harvested after growth in the dark (DD) or following a 15 (LL15) or 60 (LL60) min light treatment. (D) Plot of the relative abundance under inducing (250 µM BCS) vs. repressing conditions (250 µM CuSO4) of the indicated messages in WT (black boxes) and Ptcu-1 adv-1 (gray boxes) strains (n = 3). The asterisks represent statistical significance by a Student’s t-test (* P < 0.002).

