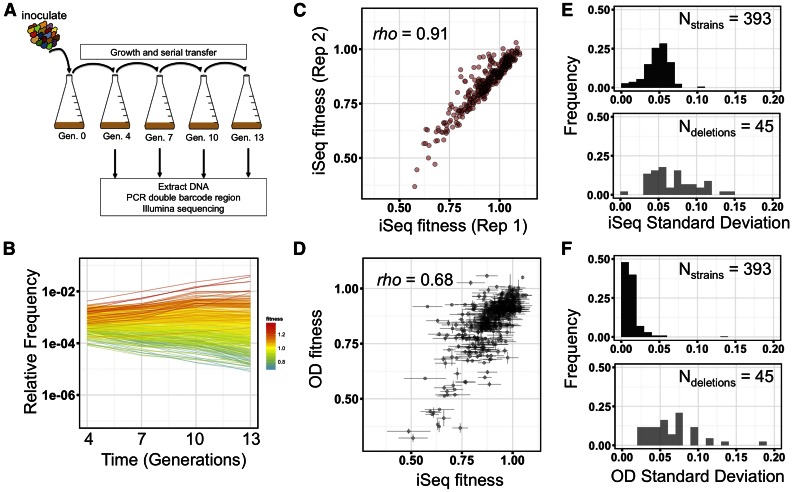
Figure 2.
iSeq pooled fitness assay and reproducibility of measurements. (A) A schematic of the iSeq pooled fitness assay. Double-barcode pools are grown by serial transfer every ∼3 generations. At each transfer, relative double-barcode frequencies are assayed by short-read amplicon sequencing. (B) Representative plot of relative frequencies from a pooled fitness assay. Each line is an individual double-barcode strain. Colors indicate the fitness estimate of each strain. (C, D) Scatter plot of fitnesses between two biological replicates of the iSeq assay (C) or between iSeq and a multi-well OD-based measurement (D). Spearman’s rho is shown on each plot. (E, F) Frequency distributions of SD of the same double barcode across three growth replicates (black), or the same double deletion across four to eight double barcodes (gray) for iSeq (E) or OD-based (F) fitness measurements.

