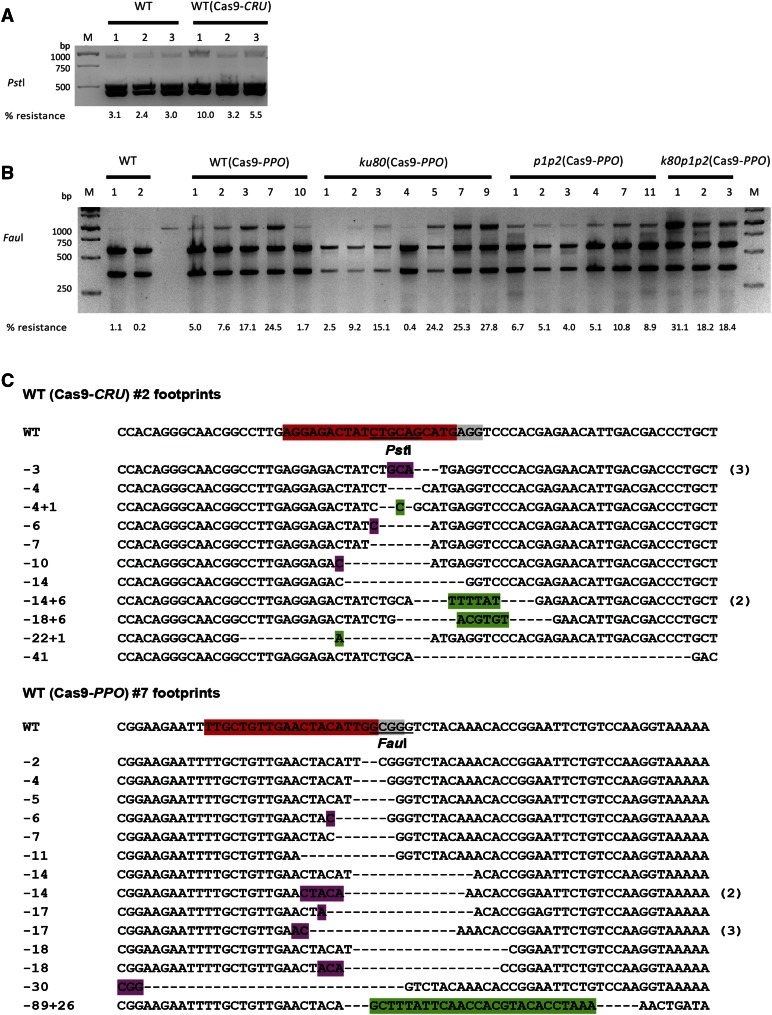
Figure 2.
CRISPR/Cas9 endonucleases-induced mutagenesis. (A) The CRU3 target site was amplified using undigested genomic DNA from untransformed wild-type seedlings and Cas9-CRU-transformed T2 seedlings and digested with PstI. (B) The PPO target site was amplified from untransformed wild-type seedlings and Cas9-PPO-transformed T2 seedlings of wild-type and ku80, parp1 parp2 (p1p2), and ku80 parp1 parp2 (k80p1p2) mutant plant lines and digested with FauI. M is the 1 kb DNA marker, with sizes of the bands at the left, and the % resistant bands is shown below the lanes. (C) Sequences of CRU3 and PPO targets from Cas9-CRU transformant #2 and Cas9-PPO transformant #7. The sgRNA protospacer is in red, PAM sequence is in gray, restriction sites are underlined, deletions are shown by dashes, insertions are in green, and microhomologies used for repair are in purple. Number of multiple clones with the same sequence are shown at the right. Numbers are length of deletions (−) and insertions (+).

