Figure 3.
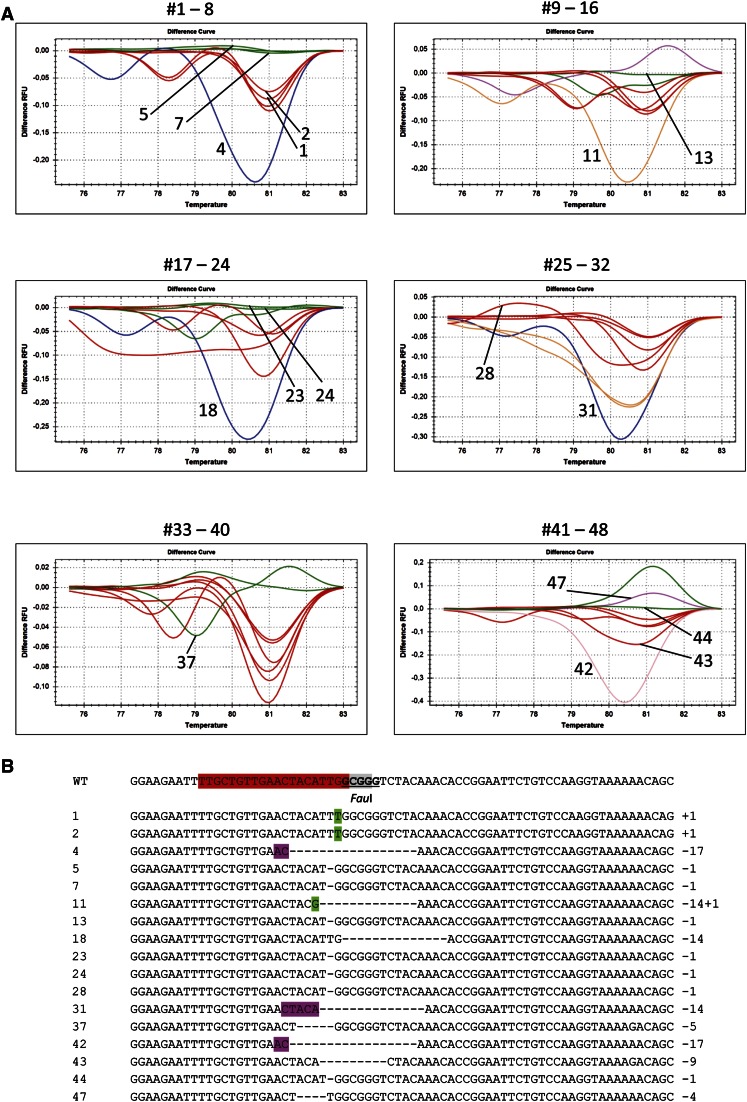
HRM analysis of the PPO target. HRM analyses were performed on 48 PCR clones from undigested DNA of a pool of 10 T2 seedlings of wild-type Cas9-PPO transformant #7. (A) Melt curves of samples 1–48 measured in relative fluorescence units (RFU). Numbers indicated in the graph refer to the sequences below. (B) Sequences of representative PPO targets. PPO sgRNA protospacer (red), the PAM sequence (gray), and FauI restriction site (underlined) are indicated in the wild-type (WT) sequence. Footprints included deletions (dashed lines) and insertions (green). Microhomologies used for repair are shown in purple.

