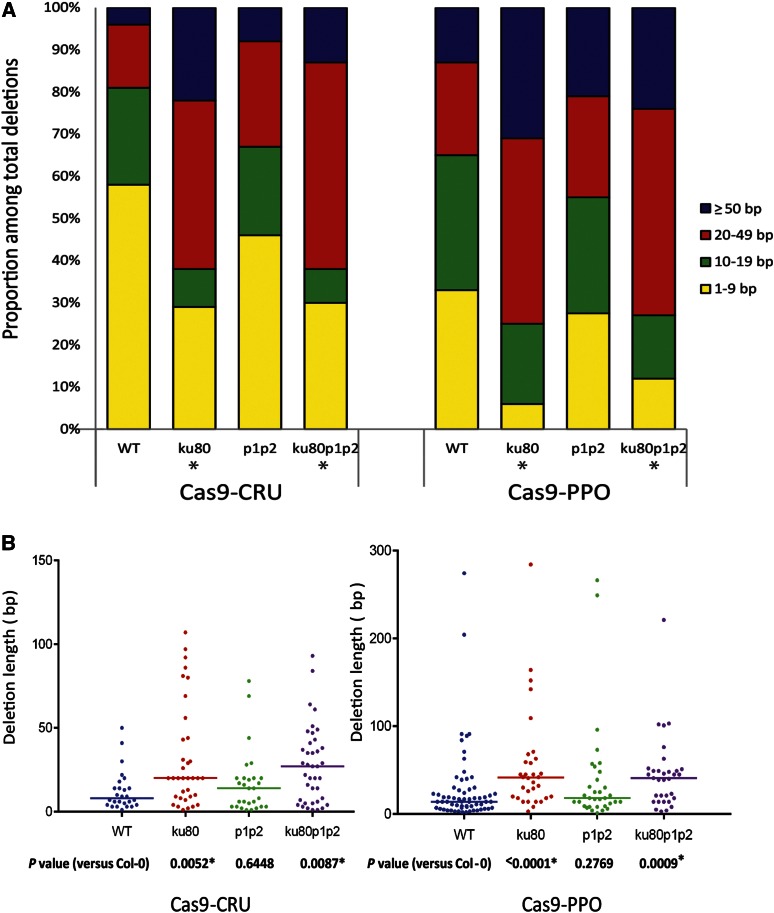
Figure 4.
Analysis of deletion length. (A) Distribution of deletion lengths of mutated sequences obtained for the indicated genotypes with Cas9 nucleases. (B) Scatter plot of deletion lengths of the sequences used in (A). Median deletion lengths are indicated by horizontal lines. P-values are derived from a two-tailed Mann–Whitney U-test. Asterisks (*) indicate a statistically significant difference from wild type (P < 0.05).

