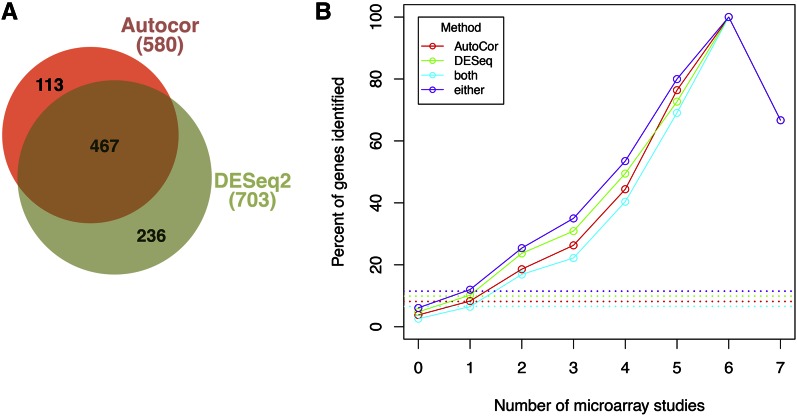
Figure 2.
Identifying genes that respond to hypoxia in a time-dependent manner. (A) A Venn diagram showing that the two statistical methods used in this study detected largely overlapping sets of genes. The total number of genes detected by each method is shown in parentheses. (B) Our RNA-seq and statistical methods were more likely to identify well-known oxygen-regulated genes. The x-axis represents the number of independent microarray studies in which a gene was shown to be oxygen-regulated (as calculated in Table S3). The y-axis represents the percentage of those genes that were identified by the indicated method (both = AutoCor and DESeq2; either = AutoCor or DESeq2). The four curves overlap at x = 6 and x = 7. Each dotted line shows the percentage of genes in the genome that are detected by the indicated method. RNA-seq, RNA sequencing.

