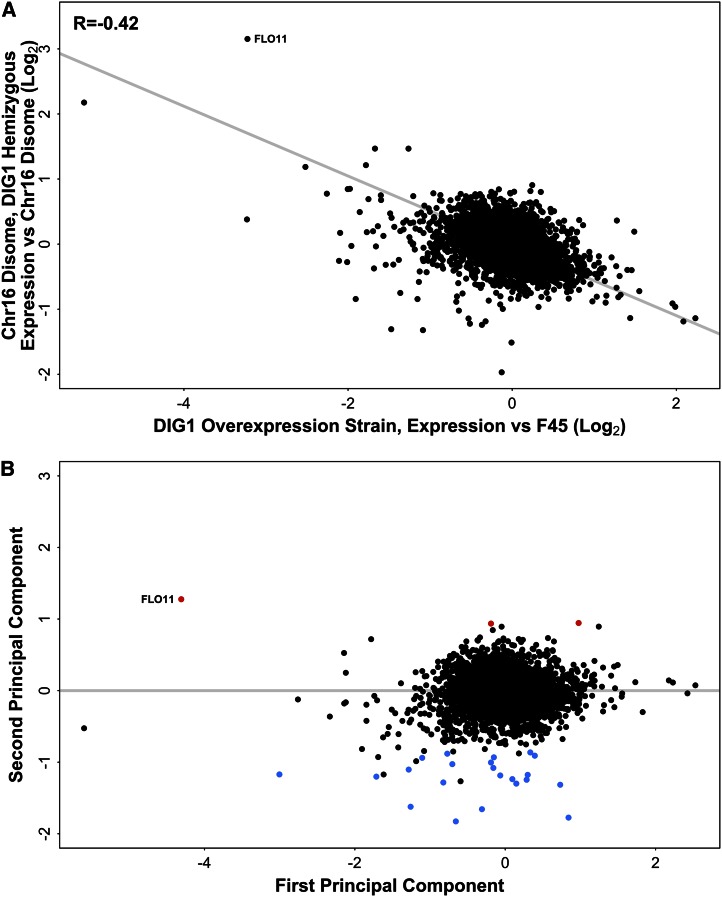
Figure 4.
(A) Differential gene expression in the DIG1 overexpression strain, relative to F45 (with empty vector) and the hemizygous DIG1 derivative (DIG1/dig1Δ) of the chromosome XVI disome, relative to the full chromosome XVI disome. Gray line indicates TLS regression. (B) Rotation of the data using PCA. First principal component (x-axis) is equivalent to the TLS regression line in (A). Genes with significantly higher than expected expression in the hemizygous DIG1 strain are shown in red, genes with significantly lower than expected expression in blue. PCA, principal component analysis; TLS, total least squares.

