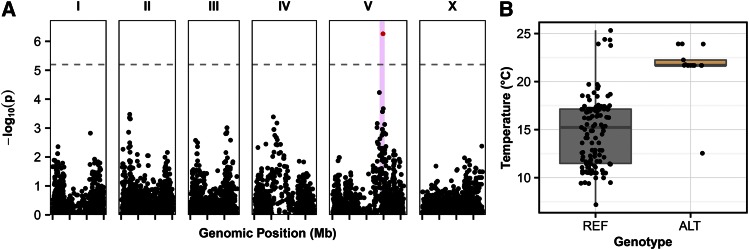
Figure 4.
GWA of temperature. (A) GWA of three-year average temperature is visualized as a Manhattan plot. Genomic position is plotted on the x-axis against the negative log-transformed p-value on the y-axis. SNVs that are above the Bonferroni-corrected significance threshold, indicated by the dotted gray line, are shown in red, and SNVs below the Bonferroni threshold are shown in black. Confidence intervals are represented by the pink bars. (B) Box plots show the strain three-year average temperatures, measured in degrees Celsius, separated by genotype at the peak marker locus. Each point represents one strain. The reference genotype (REF) refers to strains that share the genotype of the reference strain, N2. The alternative genotype (ALT) refers to all other strains that do not have the reference genotype at the peak marker position.

