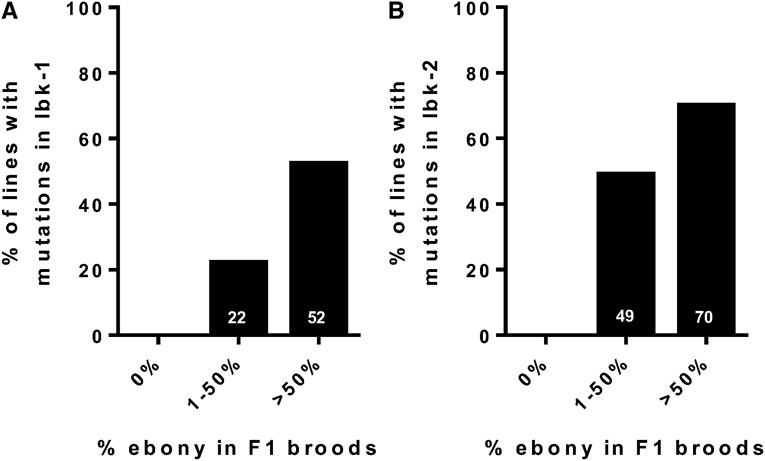
Figure 3.
Broods with a high percentage of co-CRISPR marker e are highly enriched for mutations in lbk. We plot broods from the F1 generation in three groups (0% ebony, 1–50% ebony and >50% ebony) against the percentage of F1-derived balanced with lbk-1 (A) and lbk-2 (B) mutations. We observed a strong correlation between the percentage of e in F1 broods and mutations in lbk target sites (P < 0.05 for lbk-1 and P < 0.01 for lbk-2; Pearson correlation: r2 = 0.21 for lbk-1 mutants, r2 = 0.32 for lbk-2 mutants). Total numbers of lines sequenced for lbk-1 were 24 (0%), 54 (1–50%), and 42 (>50%), and 24 (0%), 51 (1–50%) and 40 (>50%) for lbk-2.

