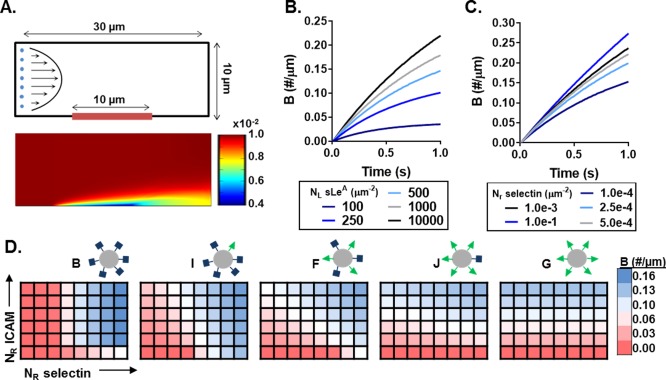
Figure 6.

Computational model of particle adhesion as a function of ligand and receptor density. (A) Simulation geometry and flow profile (top), with representative resultant particle concentration profile within the fluid (bottom) in #/µm2. Bound particles not represented in the visualization. The bound particle concentration (B) over time at constant shear 200s− 1 with (B) constant receptor (N R) density, and (C) constant ligand (N L) density. (D) Heat maps of B at 1s and constant shear 200s− 1 as a function of N R‐ICAM and N R‐selectin for five particle combinations with varied N L ratios. Blue indicates N R conditions of more adherent particles and red indicating conditions of fewer adherent particles. N R‐ICAM ranges from 1 × 10⁻⁶ to 3 × 10⁻⁴/µm2, while N R‐selectin ranges from 1 × 10⁻⁶ to 3.5 × 10⁻⁵/µm2, both equally spaced
