
Figure 3.
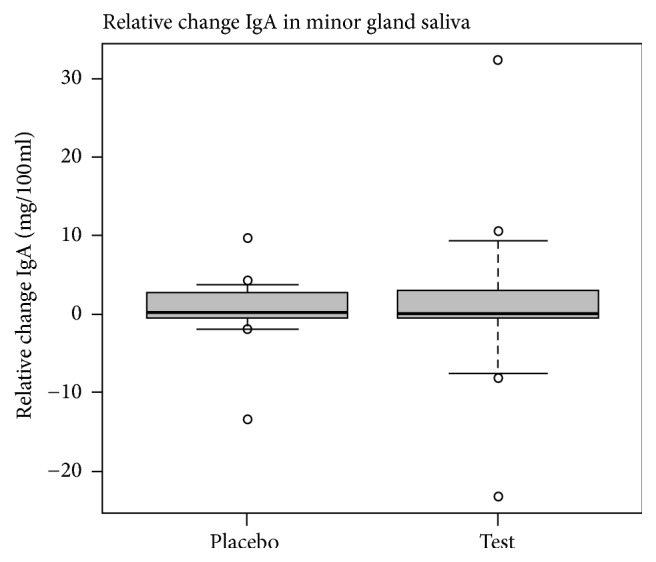
Relative change in median minor gland IgA sample, shown as mg/100 mL, comparing day 0 to day 14. The box shows the 25th and 75th percentiles and the error bars the 10th and 90th percentiles. The dots show outliers. All data is included.
Official websites use .gov
A
.gov website belongs to an official
government organization in the United States.
Secure .gov websites use HTTPS
A lock (
) or https:// means you've safely
connected to the .gov website. Share sensitive
information only on official, secure websites.
Relative change in median minor gland IgA sample, shown as mg/100 mL, comparing day 0 to day 14. The box shows the 25th and 75th percentiles and the error bars the 10th and 90th percentiles. The dots show outliers. All data is included.