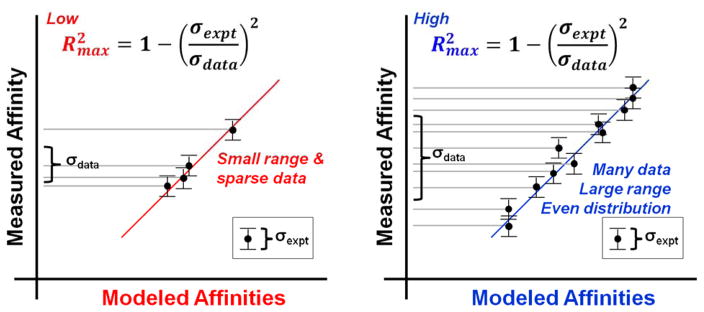
Figure 2.
The statistical limits of any model are derived from characteristics of the training data. The maximum of the model’s Pearson R (Rmax) is dictated by the standard deviation of the individual experimental values (σexpt) and the range of affinities (characterized by σdata over all the values in the dataset). Clearly, low error in the experiments leads to higher Rmax. The diagram above show the effect of varying σdata while keeping the same σexpt. They show that weak models (red) have reduced Rmax because of the low σdata that comes from tightly clustered data with few outliers. Robust models (blue) have higher Rmax from larger values for σdata that come from adding data, extending the max–min limits of the data, and/or more evenly covering the range of data.

