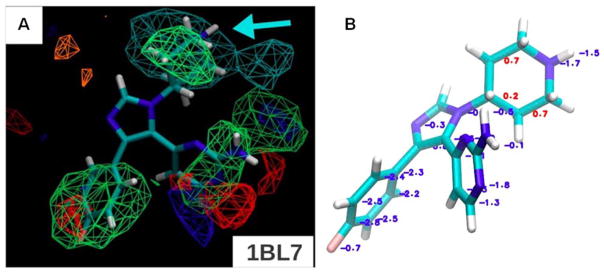
Figure 8.
A) For p38 MAPK, the minimized crystal conformation is shown for the 1BL7 complex from the PDB, but the protein is not shown to emphasize the fit of the ligand in the maps. All FragMaps are drawn with a −1.2 kcal/mol cutoff. The FragMaps are colored green for nonpolar, blue for hydrogen-bond donor, red for hydrogen-bond acceptor, orange for negative acceptor, and cyan for positive donor. (B) Boltzmann-averaged GFE are shown for the atoms of the ligand in 1BL7. Favorable GFE values are displayed in blue and unfavorable in red. This figure is a composite of Figure 2d and Figure 7b from reference 41.

