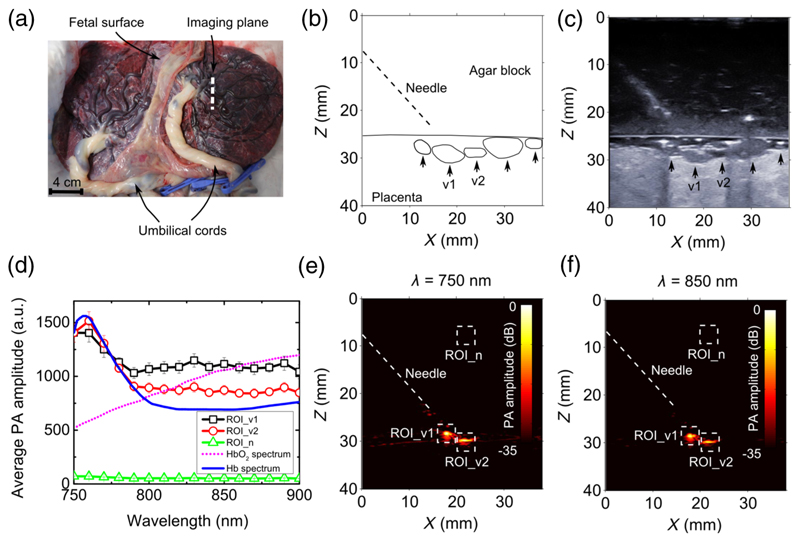
Fig. 4.
Multispectral photoacoustic images of the human placenta. (a) Photograph of the human twin placenta, with the location from which ultrasound and photoacoustic images were acquired, indicated with a white dashed line. An ultrasound image of the placenta together with the structure outlines are shown in (b) and (c). Coregistered photoacoustic images at wavelengths of 750 and 850 nm are shown in (e) and (f). Two veins [v1 and v2 in (b) and (c)] are clearly visible in the photoacoustic images. Average photoacoustic amplitudes for regions of interest (v1: ROI_v1; v2: ROI_v2; background noise: ROI_n) indicated in (e) and (f) are compared with the absorption spectra of oxygenated and deoxygenated blood in (d) for wavelengths from 750 to 900 nm. The oxygenated and deoxygenated blood spectra are normalized to the measured average photoacoustic amplitudes at 750 nm. The photoacoustic signal amplitudes in (d) are presented as averages over 15 image frames, with error bars representing standard deviations.

