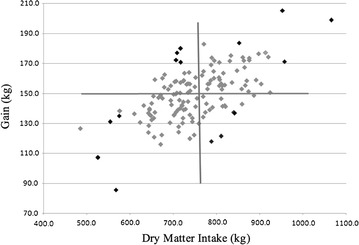
Fig. 1.

Total dry matter intake and total gain for steers on feed trial (n = 143). The average for gain is represented by the horizontal line and the average for intake is represented by the vertical line. The bivariate mean is the intersection of these lines. Steers chosen for the study are represented by the black data points
