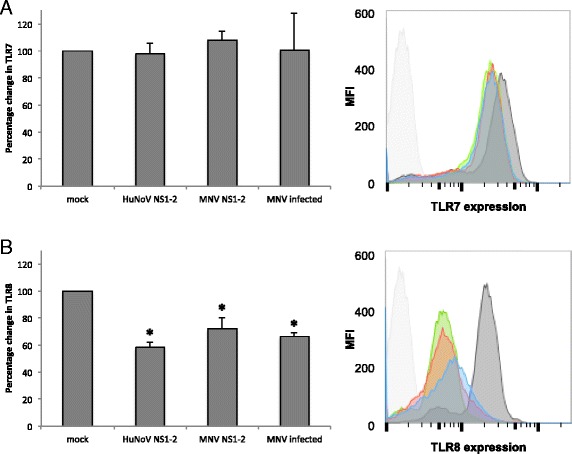
Fig. 7.

Toll-like receptor expression. Raw-Blue cells were infected with MNV or transfected with RNA constructs expressing HuNoV and or MNV NS1-2 for 12 h. Cells were stained with TLR7 and TLR8 antibodies and analysed using flow cytometry (BD Fortessa). The expression of TLR7 and TLR8 were normalized to mock transfected cells, and the percentage change in TLR expression is shown for a TLR7 and b TLR8. Data shown indicates average and standard deviation of 3 separate experiments. * p value <0.5, paired t-test. Representative flow cytometry plots from a single experiment with isotype control (light grey), cells control (dark grey), HuNoV NS1-2 (blue), MNV NS1-2 (red), and MNV infected (green) shown as histograms
