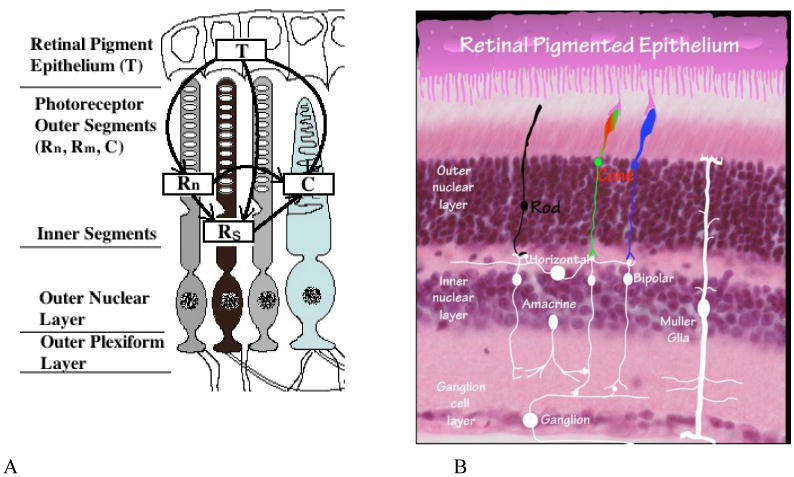
Figure 1.

Anatomy of the retina. Panel A. Flow-diagram of photoreceptor interactions affecting RP. Here we assume two distinct classes of rod cells depending on whether or not they have had their functionality compromised in any way as a result of the genetic mutation and distinguish them as normal and sick rods, Rn and Rs respectively. See [29]. Panel B. Histology image of retina. This picture shows the histology of the retina to compare with the interactions in Panel A.
