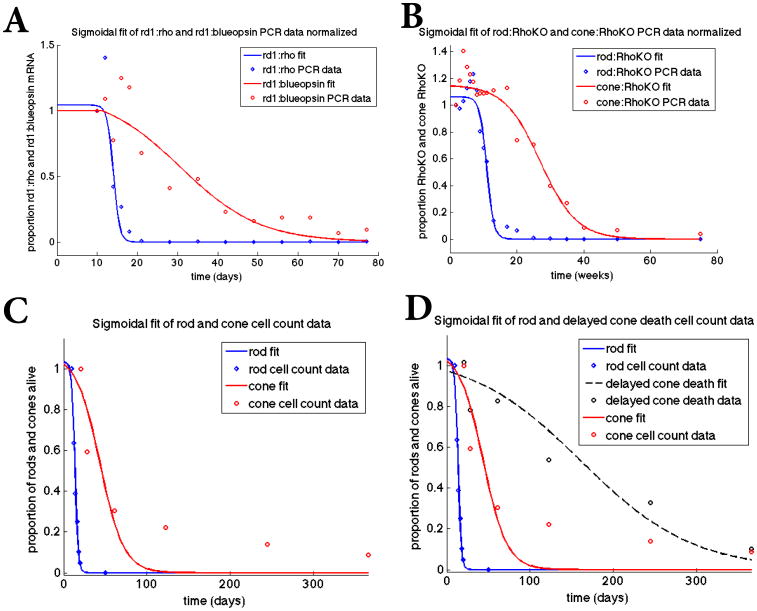
Figure 2.
Sigmoidal fit of mathematical model to datasets. Top panels: Fit of sigmoidal curves to the rd1 transcript data (Panel A) from P10 to P77 and the Rho-KO transcript data (Panel B) from P12 to 75 weeks, where the transcript data is used as a proxy for the number of rods and cones alive. The data points in all panels were obtained by normalizing the data by its first data point thus making all the data points as a proportion of this first data point value (before degeneration began). We use a sigmoidal function of the form p/(1 + exp(q*(t-r))) together with a nonlinear least squares method to find p, q, and r via MATLAB's nlinfit. In Panel A, [p,q,r]=[1.04, 1.29, 14.0] for the rods and [p,q,r]= [1.14, 0.101, 30.6] for the cones. In Panel B, [p,q,r]= [1.06, 0.938, 10.9] for the rods and [p,q,r]= [1.15, 0.185, 27.1] for the cones. Panel C: Fit of sigmoidal curves to actual cell count data from rd1 mice for rods from P10-P20 and cones from P21 to P365. For the rods, [p,q,r]= [1.03, 0.545, 13.4] and for the cones, [p,q,r]= [1.07, 0.0703, 43.6]. Panel D: Fit of sigmoidal curves to cone data from rd1 mice data (red curve same as in Panel C) and rd1 mice in which cone death was delayed by improving nutrient uptake and utilization (black line) through the mTOR pathways. The experimental data was taken over 365 days and represents actual cone quantification.

